
Population in Somerset (2021 Census)
Somerset’s population at the time of the 2021 Census was 571,600, an increase of 7.8% on the 2011 Census (529,972).
Figure 1 shows how the forecasted population increase is proportioned between age-band and sex. The greatest change in population is the increase in men and women over the age of 65 between 2023-2030 and 2023-2040, where the under 65 is largely projected to stay the same between 2023-2040.
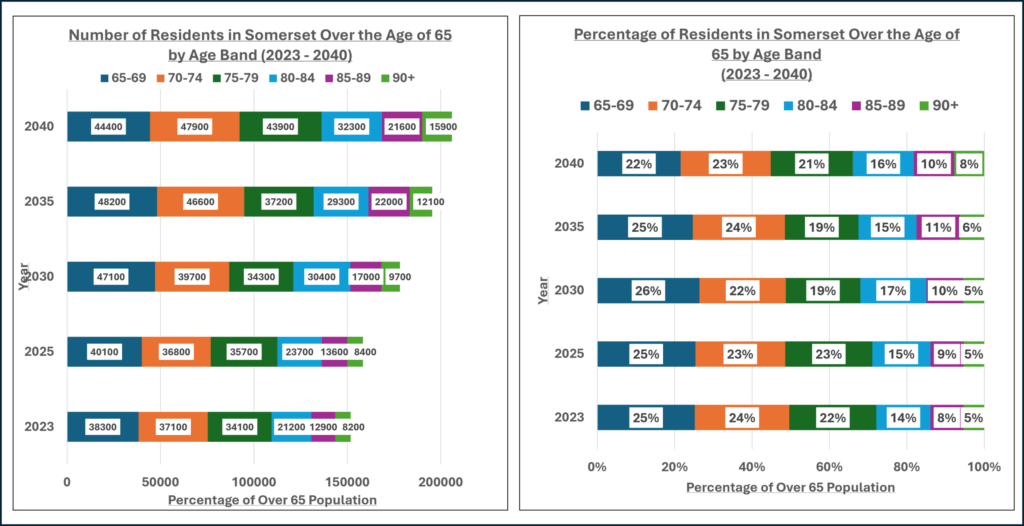
Figure 1: Percentage Change in Population Age Band from 2023-2040 (Source Data: POPPI)
Urban-Rural Somerset
Somerset Council serves over 570,000 residents and 250,000 households in areas which range from remote rural dwellings to urban town, and small city, centres.
Ethnicity
At the time of the 2021 Census, 96.3% of Somerset’s residents identify themselves as belonging to a white ethnicity group and, approximately 3.7%, identifying as non-white ethnicities. Despite non-white ethnicities constituting a small proportion of Somerset’s residents, ethnic diversity is increasing in Somerset (from 2% in the 2011 Census).
| Race and Ethnicity | Count of Usual Residents | Percentage of Usual Residents |
|---|---|---|
| Asian, Asian British or Asian Welsh | 8658 | 1.51% |
| Black, Black British, Black Welsh, Caribbean or African | 2436 | 0.43% |
| Mixed or Multiple ethnic groups | 7137 | 1.25% |
| Other ethnic group | 2469 | 0.43% |
| White: English, Welsh, Scottish, Northern Irish or British | 521833 | 91.30% |
| White: Gypsy or Irish Traveller, Roma or Other White | 26387 | 4.62% |
| White: Irish | 2630 | 0.46% |
Table 1: 2021 Census: Race and Ethnicity Status by Number of Individuals.
Religious and Spiritual Beliefs
Somerset’s religious and spiritual beliefs are predominantly Christian (50.1%), followed by no religion (41.5%). Hinduism (0.19%), Judaism (0.08%), Buddhism (0.34%), Sikhism (0.03%) and Islam (0.45%), constitute 1.09% of Somerset residents religious and spiritual belief. 0.69% of Somerset’s population also describe themselves as following other religions.
| Religious Status | Count of Usual Residents | Percentage of Usual Residents |
|---|---|---|
| Buddhist | 1930 | 0.34% |
| Christian | 286672 | 50.16% |
| Hindu | 1104 | 0.19% |
| Jewish | 451 | 0.08% |
| Muslim | 2598 | 0.45% |
| No religion | 237262 | 41.51% |
| Not answered | 37379 | 6.54% |
| Other religion | 3962 | 0.62% |
| Sikh | 190 | 0.03% |
Table 2: 2021 Census: Religion Status by Number of Individuals.
English as a First Spoken Language
Over 99% of Somerset’s population speak English either as their main language, or to a good level as a secondary language. At the time of the 2021 census there were 515 Somerset residents aged over 3 who could not speak English, with a further 3244 who reported not being able to speak English well.
Our Population and the Adult Social Care Sector
In regard to the delivery of adult social care, the forecasted increase of older persons within Somerset will mean that the adult social care service and sector will have to negotiate an increasingly demanding market and landscape.
Figure 2, in only taking baseline estimates of Somerset’s adult population demonstrates that Somerset Council will have a baseline of 11,000 adults using services by 2040. It is likely that this figure is an underestimate.
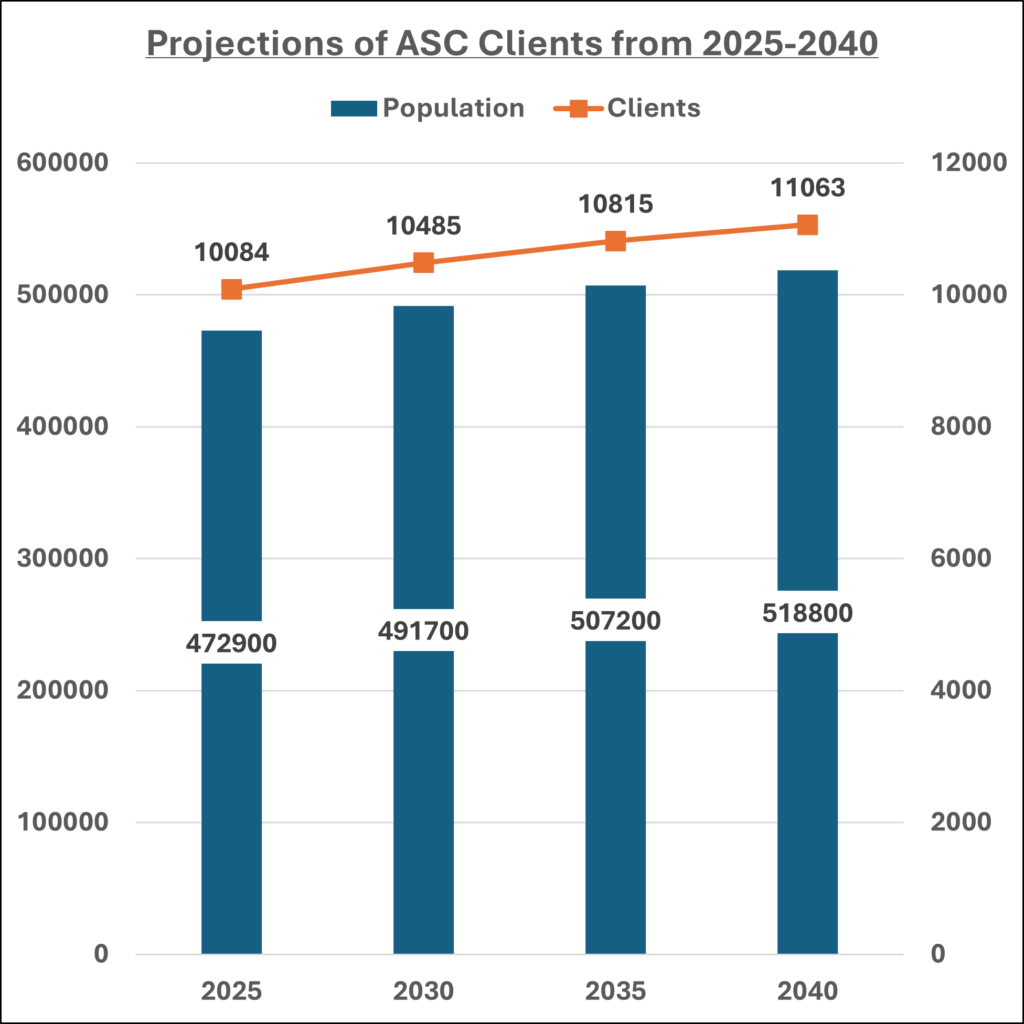
Figure 2: Projections for Number of Adult Social Care Clients in Somerset.
Please see additional population information with regard to Older Adults, Working Age Adults and Unpaid Carers below:
Somerset's Ageing Population
Somerset’s population is ageing and it is forecast to continue to age into the future. Numerous factors can influence an ageing population, for example: young people leave the county to access higher education or employment opportunities, and internal migrants moving to Somerset to retire.
Figure 1 shows how the population of older-aged adults (aged 65+) are forecast to increase by 35.7% between 2023-2040, and those over the age of 85+ nearly double from 2023-2040.
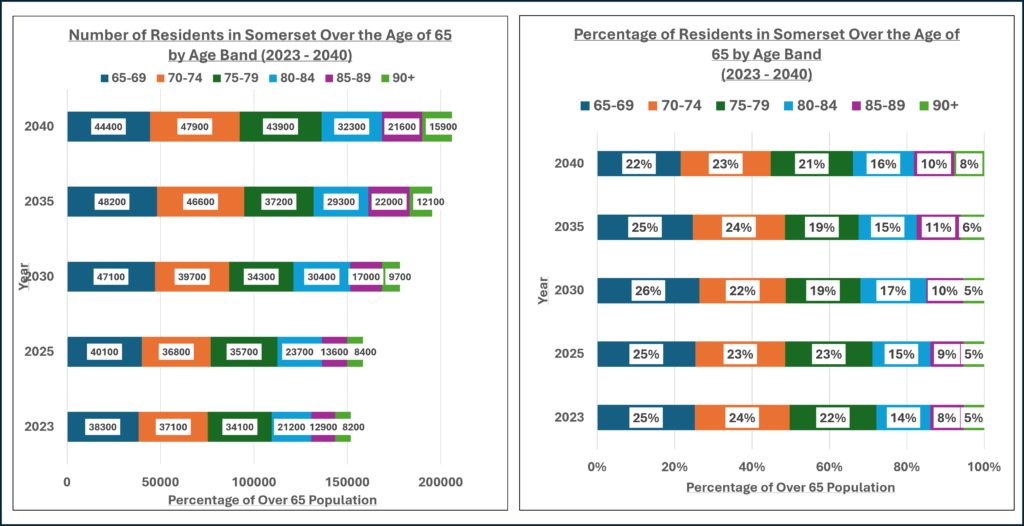
Figure 1: Population Projections for Older-Aged Adults in Somerset from 2023-2040 (Source Data: POPPI)
Older Aged Adults Who Need Help with Self-Care or Domestic Tasks
The number of adults aged 65+ who require support with at least one selfcare activity, or at least one domestic task is projected to increase by 42.2 % up to 2040 (Figure 2).
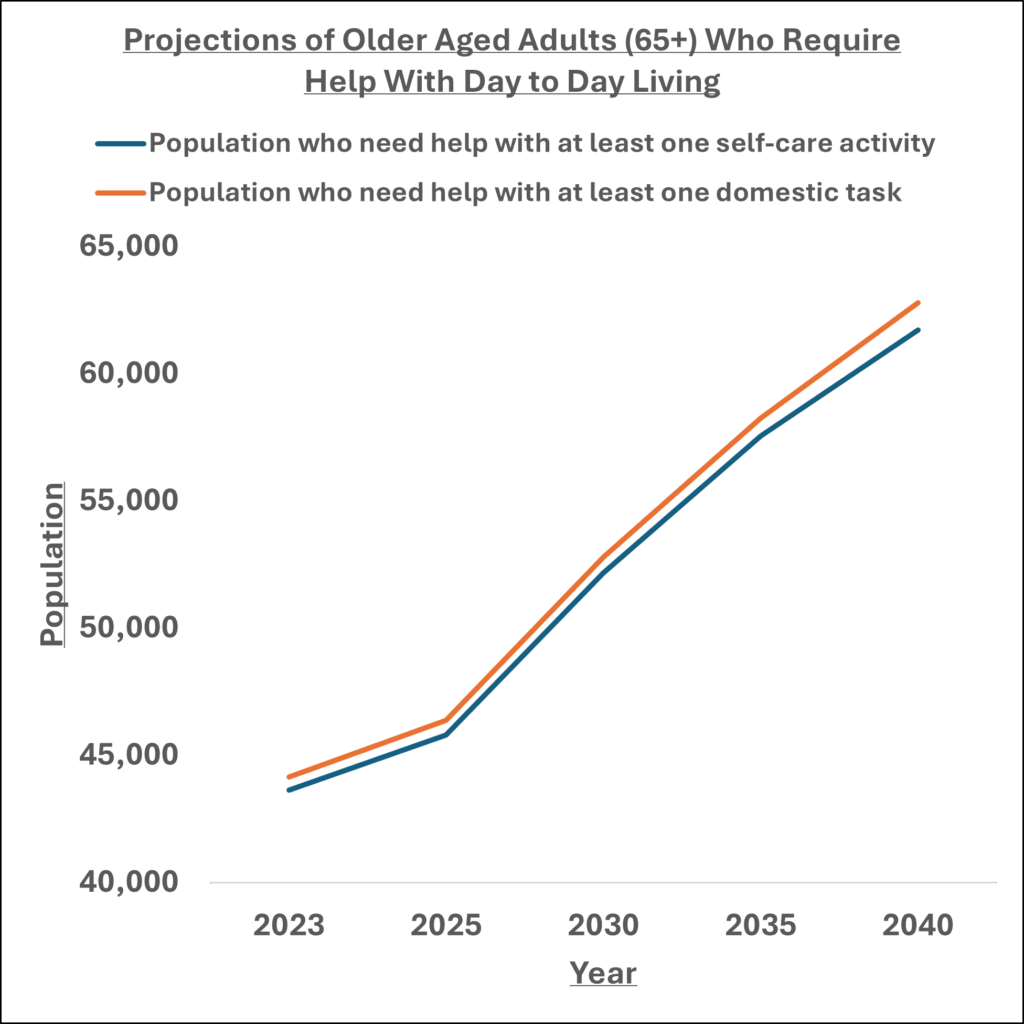
Figure 2: POPPI: Projections for Number of Older Aged Adults Who Need Help With One Self-Care Activity or Domestic Task.
Older Adults with Dementia
We expect to see a significant increase in the number of of older adults with a dementia between 2023 and 2040.
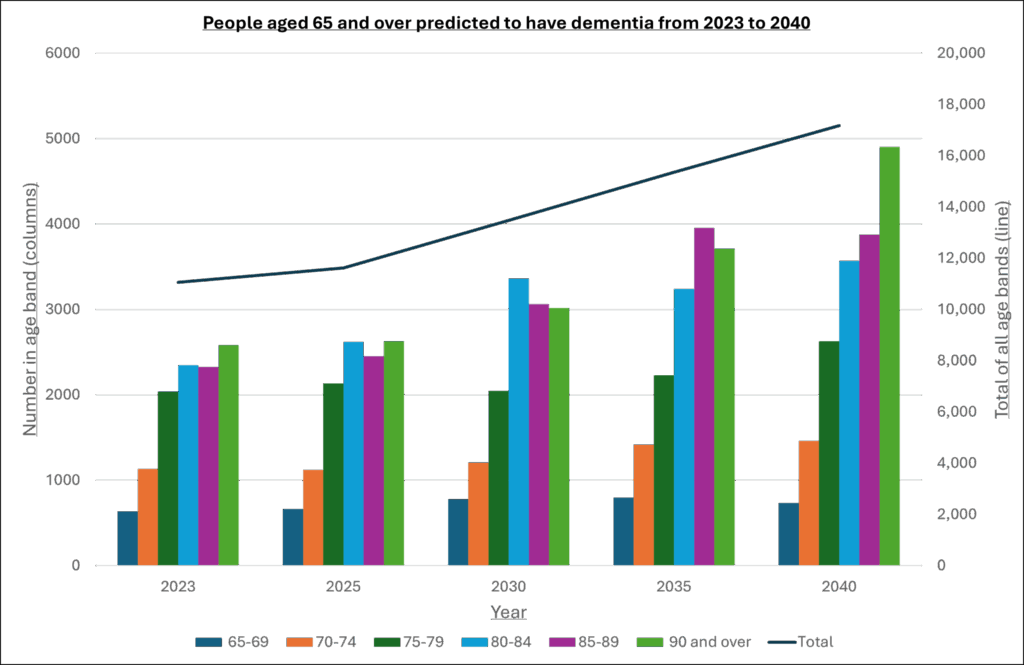
Figure 4: POPPI: Projections for Number of Older Aged Adults with Dementia (2023 – 2040)
Older Adults with Autism
The number of older-aged adults (65+) with Autism is forecast to increase up to 2040 with an 18.5% increase for individuals aged 65-74, (751 to 890) and a 50.7% increase for individuals aged 75+ (697 to 1051) (Figure 4).
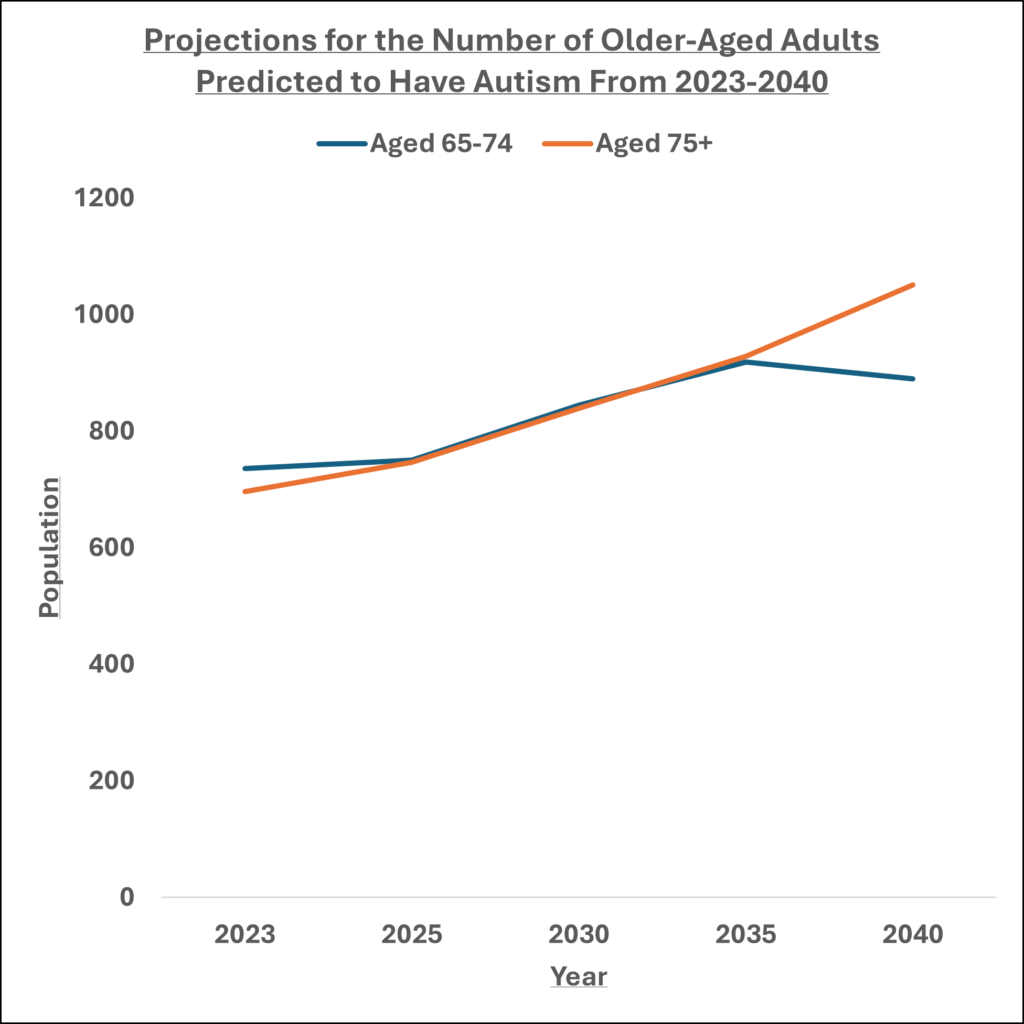
Figure 4: POPPI: Projections for Number of Older Aged Adults with Autism (2023 – 2040)
Older Adults with a Learning Disability
The number of older-aged adults (65+) with a learning disability is forecast to increase up to 2040 with a 20.6% increase for individuals aged 65-74, (1668 to 2012) and a 40% increase for individuals aged 75-84 (1121 to 1569) and a 84% increase for individuals aged 85+ (409 to 750) (Figure 4).
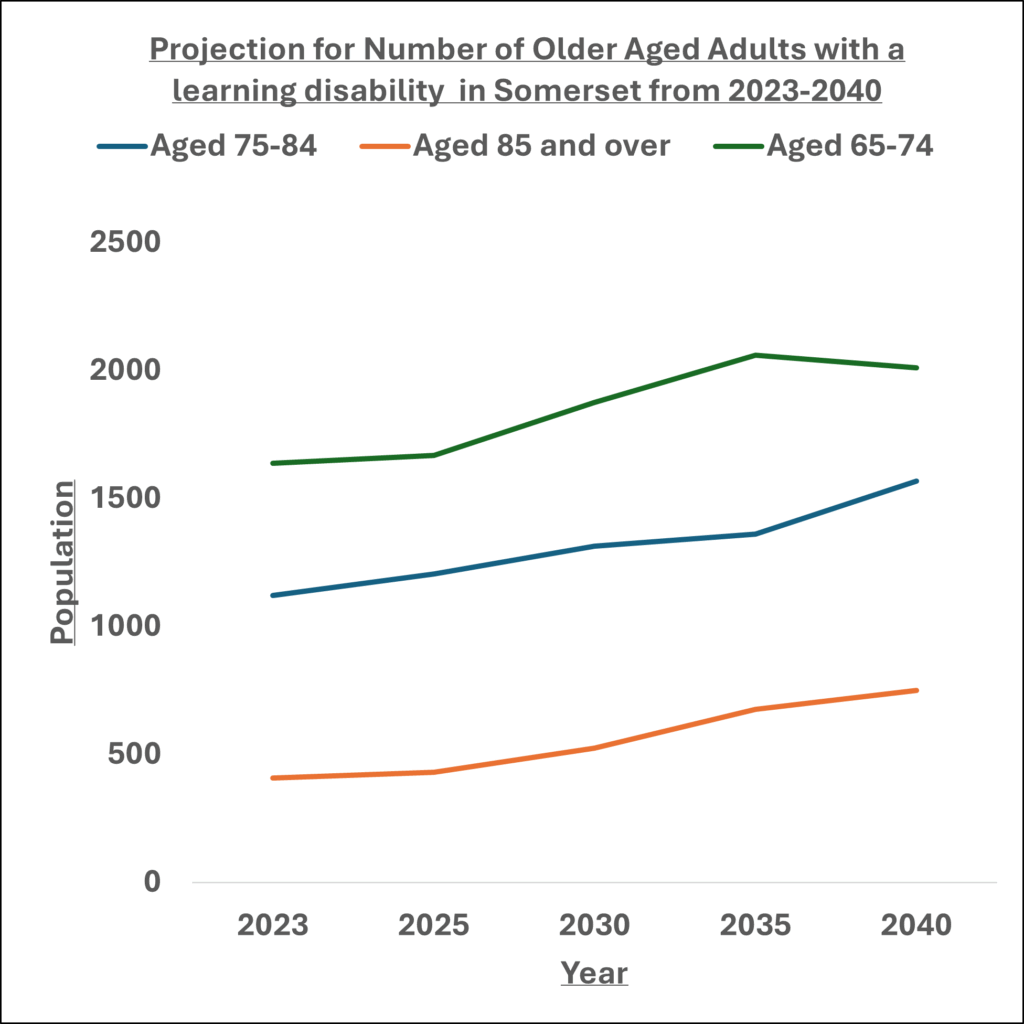
Figure 5: POPPI: Projections for Number of Older Aged Adults with a learning disability (2023-2040)
Working Aged Adults With Personal Care Needs
The number of working aged adults with moderate or significant personal care needs is projected to decrease by 3.56% up to 2040.
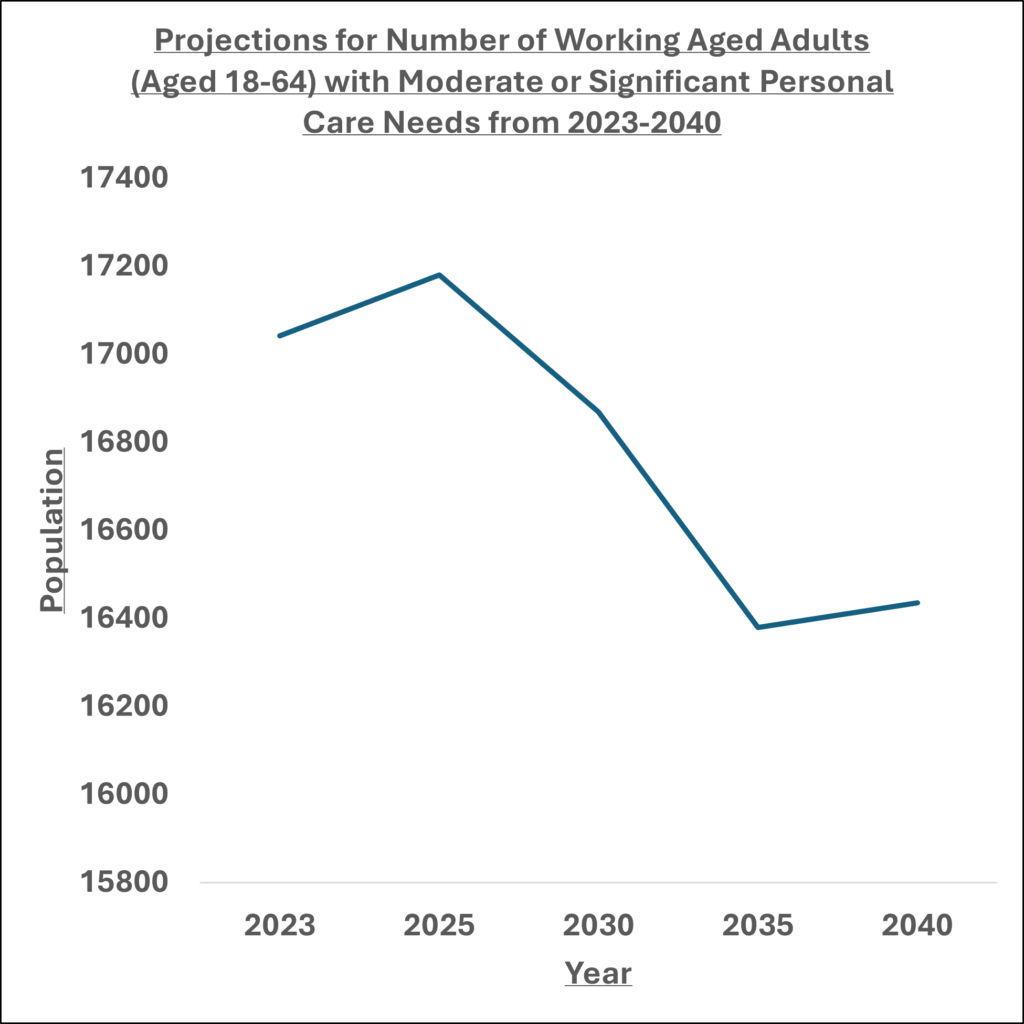
Figure 1: PANSI Number of Working-Aged Adults with Moderate or Serious Personal Care Disabilities.
Working Age Adults with Autism
The number of working aged adults with Autism Spectrum Conditions is forecast to remain constant up to 2040 (Figure 2).
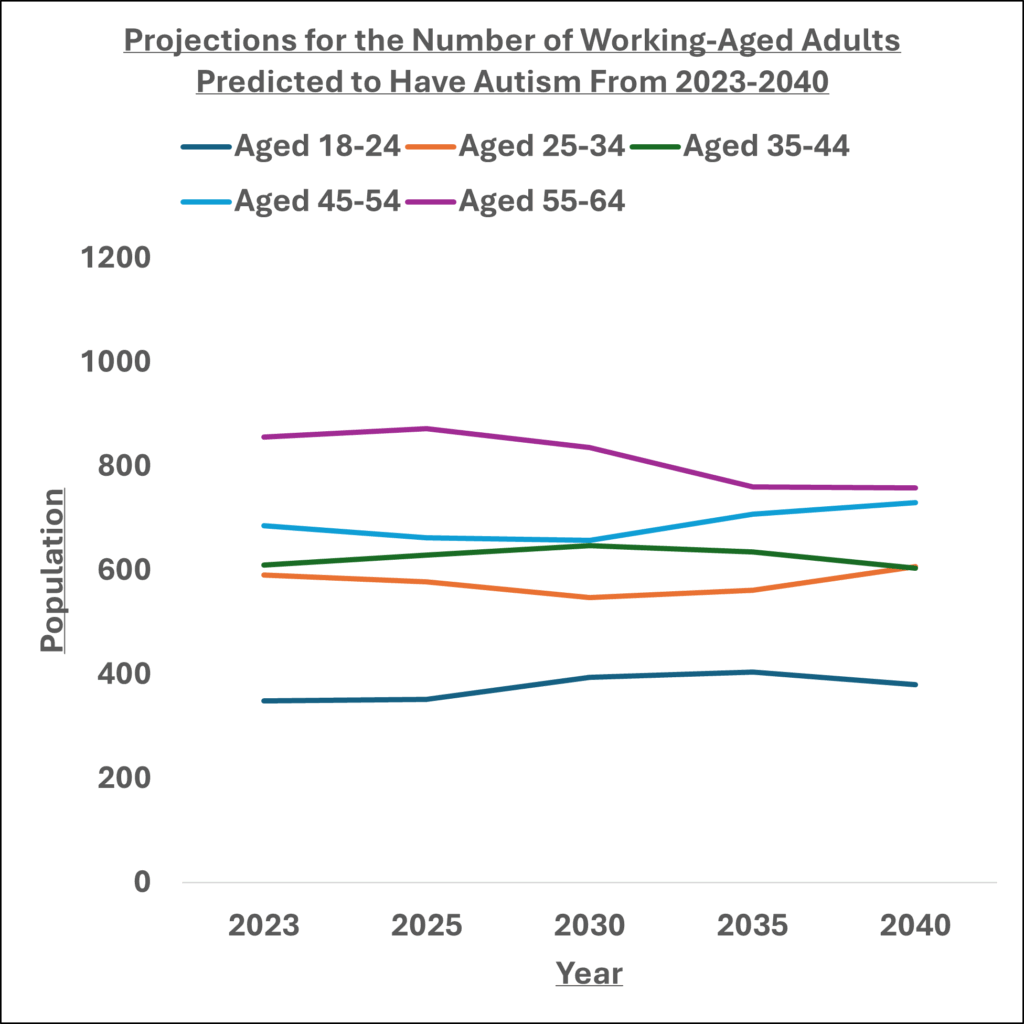
Figure 2 PANSI: Projections for Number of Working Aged Adults with Autism (2023-2040)
Working Age Adults with a learning disability
The number of working aged adults (18-65) with a learning disability is forecast to remain relatively constant up to 2040 (Figure 3), but with some fluctuations between age bands.
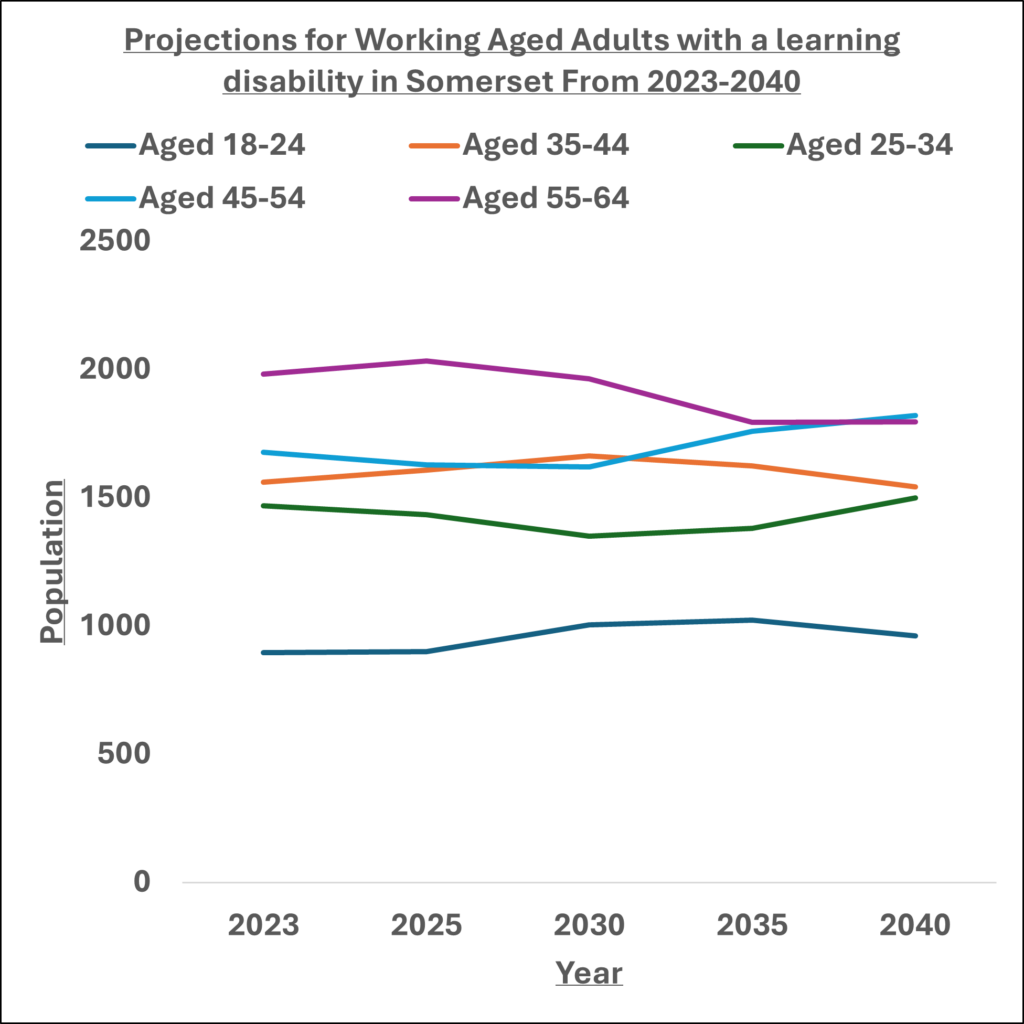
Figure 3 PANSI: Projections for Number of Working Aged Adults with a learning disability (2023-2040)
Somerset – Working-Aged Adults with Mental Health Conditions
The number of working-aged adults with mental health conditions is projected to remain constant up to 2040.
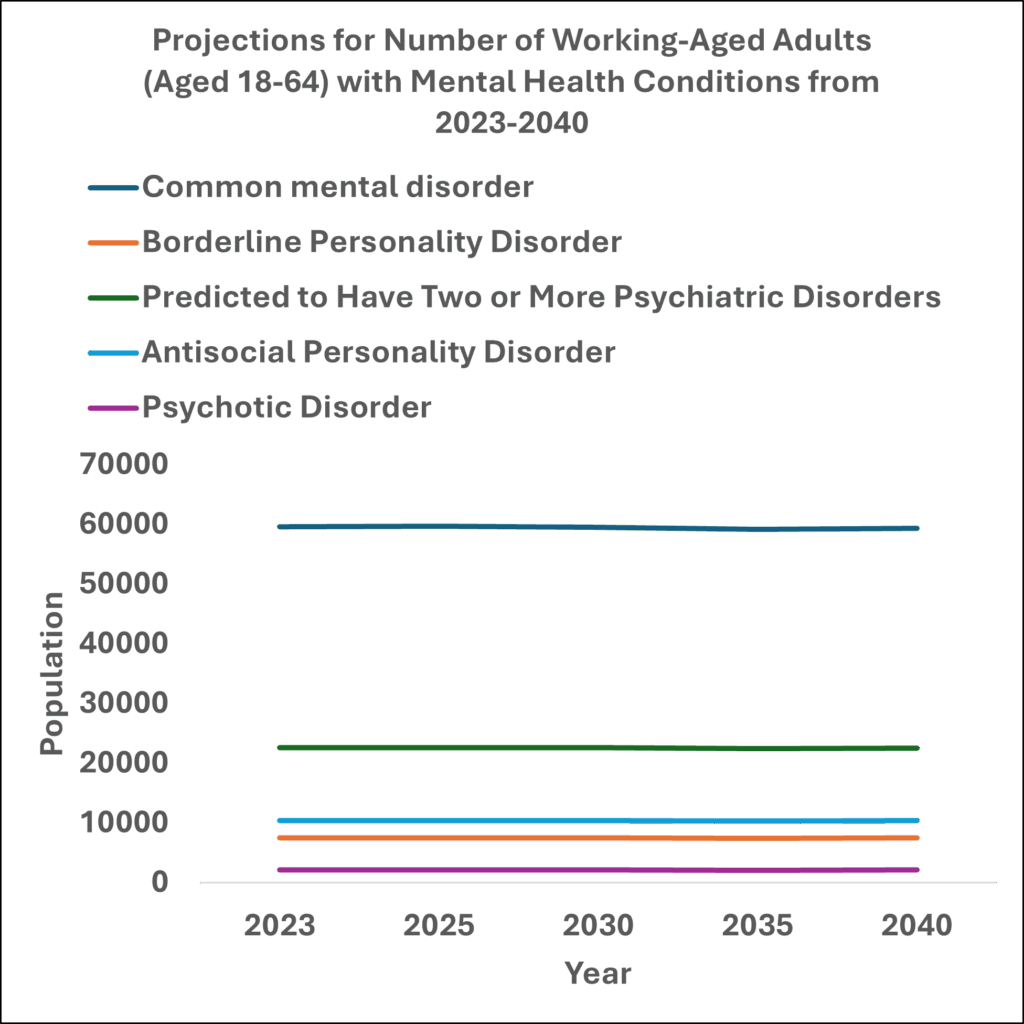
Figure 4 PANSI: Number of Working-Aged Adults with Mental Health Conditions
Somerset – Working-Aged Adults with Impaired Mobility
The number of working-aged adults with impaired mobility is projected to remain constant up to 2040, with the exception of the 55-64 age group, which is projected to decrease by 9.73%
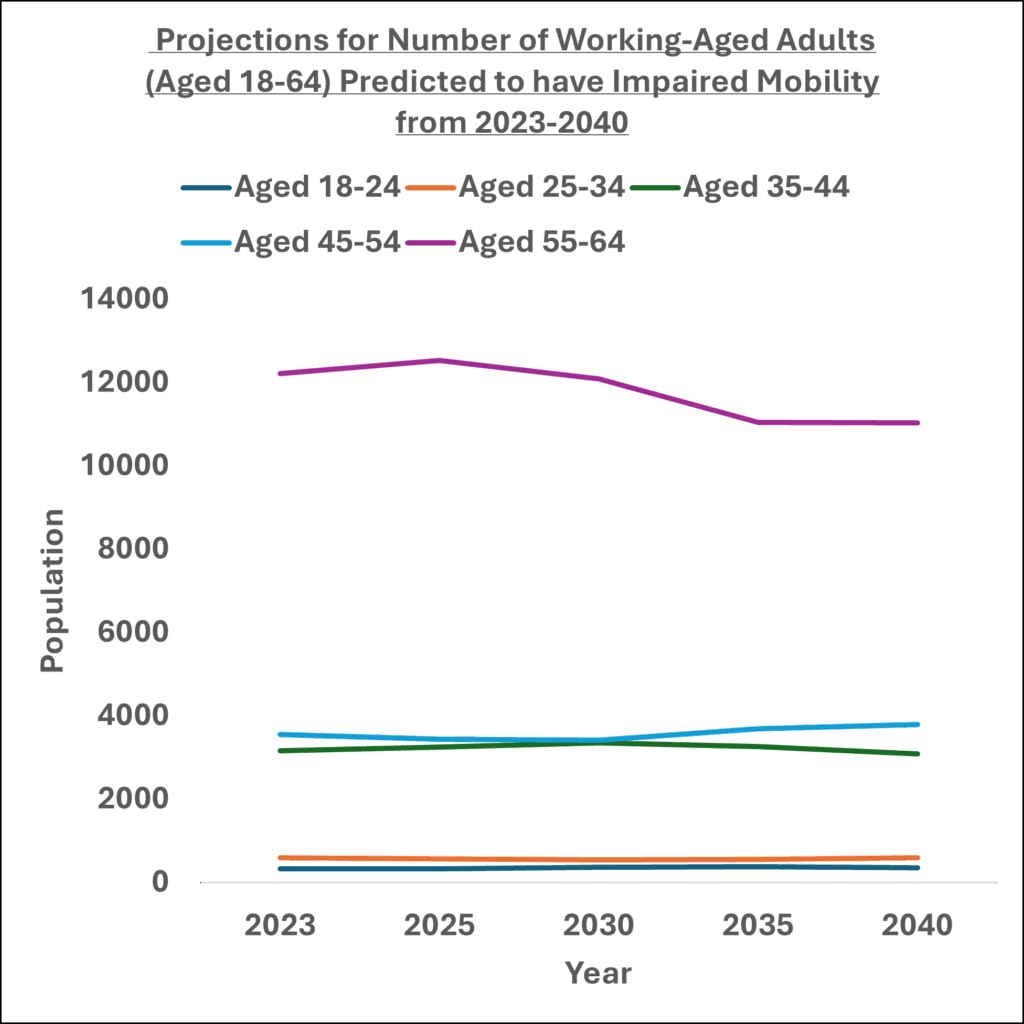
Figure 5 PANSI: Number of Working-Aged Adults with Impaired Mobility.
Unpaid carers
Data from the 2021 Census data indicates that:
- just under 50,000 Somerset residents said they provided unpaid care to a friend or relative (around 1 in 11 people).
- This is approximately 8,000 fewer than the number identified in the 2011 Census
- About 35,000 were under the age of 65.
The decrease in numbers of unpaid carers was also seen nationally, but was not uniform – numbers providing under 20 hours of unpaid care each week decreased significantly, whilst numbers providing more hours of care increased. This was a pattern seen both locally and nationally.
| Weekly hours of unpaid care | 2011 | 2021 |
|---|---|---|
| 19 hrs or less | 39353 | 26056 |
| 20-49 hrs | 6717 | 9134 |
| 50+ hrs | 12313 | 14744 |
The ONS (Office for National Statistics) have provided some additional information along with theories about the possible decreases. Potential explanations for changes in the provision of unpaid care could include:
- Coronavirus guidance on reducing travel and limiting visits to people from other households;
- Unpaid carers who previously shared caring responsibilities may have taken on all aspects of unpaid care because of rules on household mixing during the coronavirus pandemic;
- There were a higher number of deaths than expected in the older population at the beginning of 2021 due to coronavirus (COVID-19) and other causes; this could have led to a reduction in the need for unpaid care;
- Changes in the question wording between 2011 and 2021 may have had an impact on the number of people who self-reported as unpaid carers.
Somerset’s Population and Unpaid Care
As current population forecasts suggest that Somerset’s population is ageing, access to unpaid care is likely to become increasingly constrained in the future. This is because the capacity of unpaid caregivers is not expected to grow in line with the rising demand from individuals requiring such care.
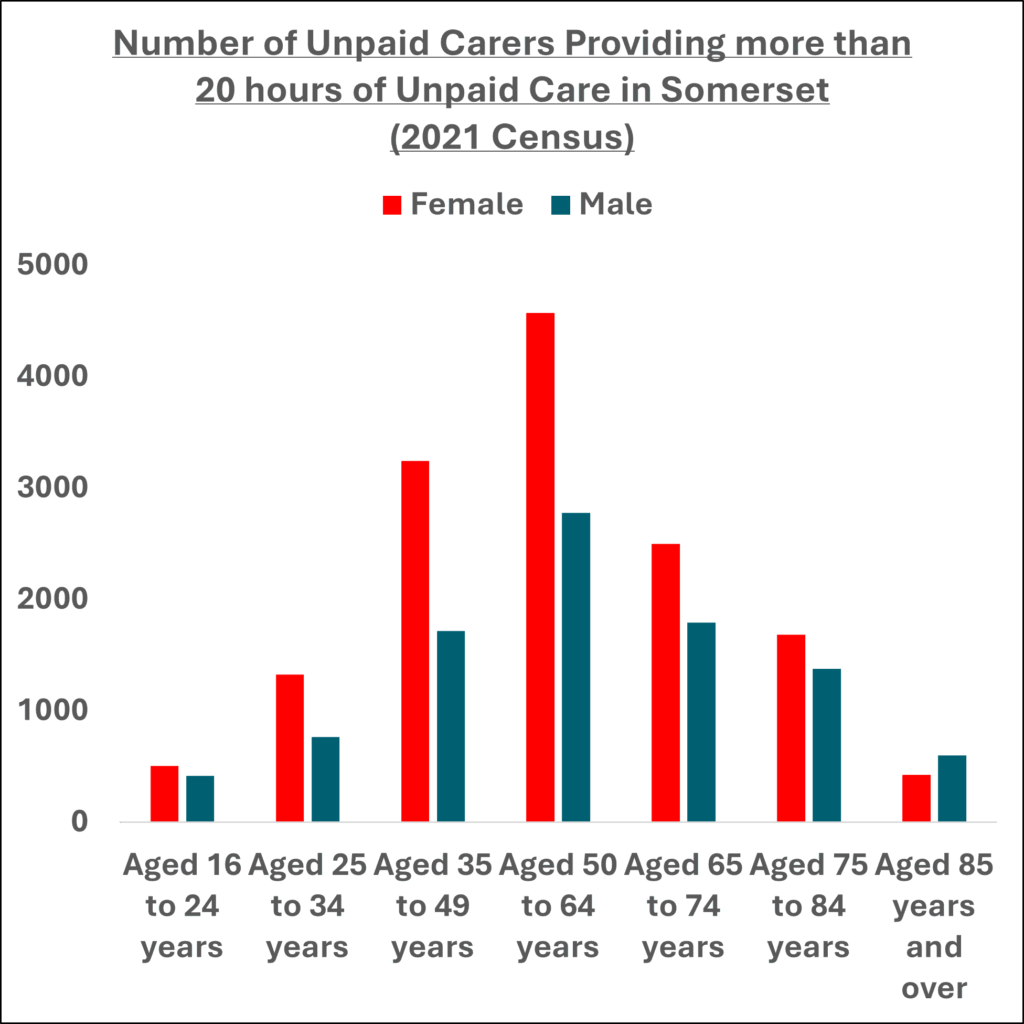
Figure 1: Clustered Column Chart Showing Unpaid Care Delivered by Sex and Age Band (Any Unpaid Care Delivered on a Weekly Basis, Source Data Census 2021).
A smaller proportion of working-age adults in Somerset may struggle to meet the care and support needs of the growing number of individuals requiring unpaid care.
Consequently, older adults, who themselves may have or develop care and support needs, could find themselves providing significant amounts of care to close relatives or relationships as they reach later stages of life. It is important to recognize that these older caregiving relationships may, at short notice, necessitate intervention or assessment from Somerset Council.
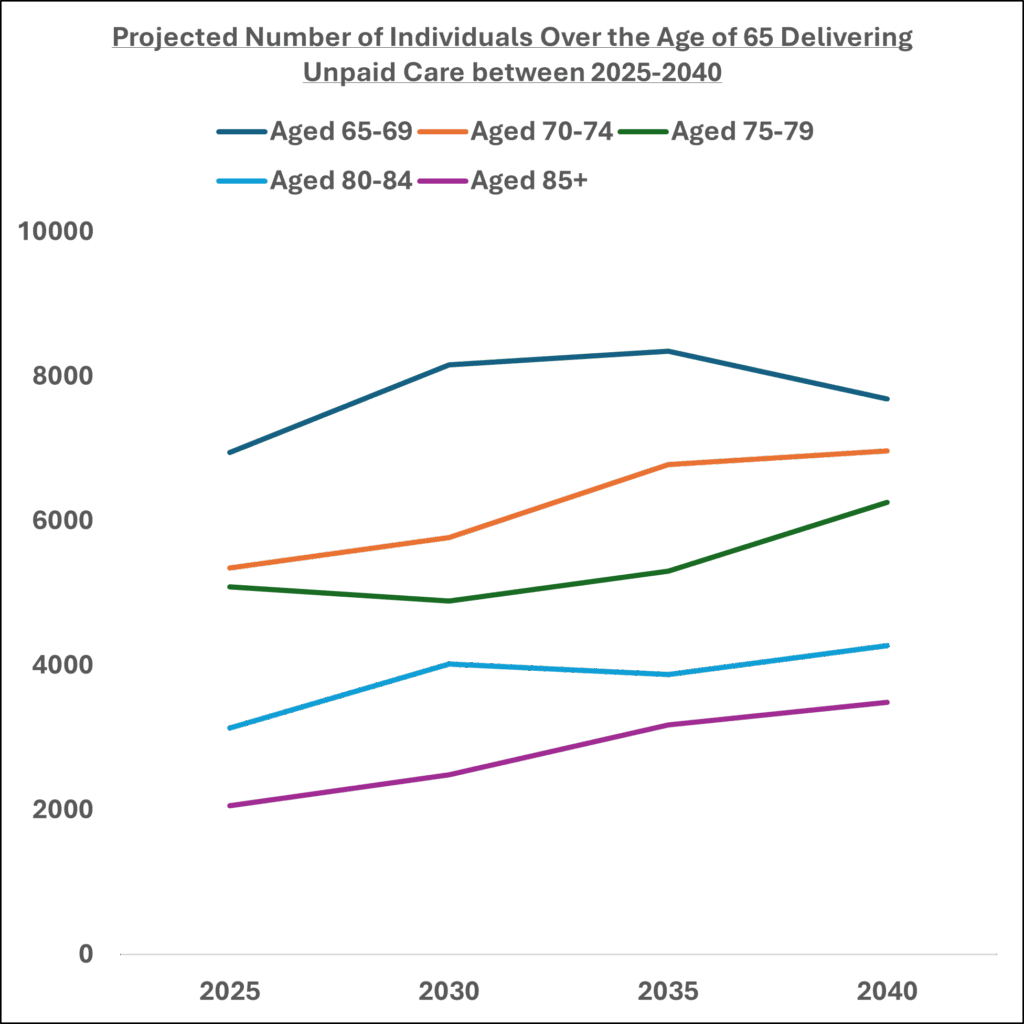
Figure 2: Projections for Number of Older-Aged Adults Providing Unpaid Care by Age Band (And Unpaid Care Delivered on a Weekly Basis, Source Data Census 2021).